> ## Documentation Index
> Fetch the complete documentation index at: https://wb-21fd5541-css-tab-borders.mintlify.site/llms.txt
> Use this file to discover all available pages before exploring further.
> Track and optimize DSPy programs with W&B to log prompts, evaluations, and compiled module performance.
# DSPy
This guide shows how to use W\&B with DSPy to track and optimize your language model programs, so you can monitor evaluation metrics, inspect how program signatures evolve during optimization, and version the resulting programs as reproducible artifacts. Use it when you want experiment tracking and observability for your compiled modules.
W\&B complements the [Weave DSPy integration](/weave/guides/integrations/dspy) by providing:
* Evaluation metrics tracking over time
* W\&B Tables for program signature evolution
* Integration with DSPy optimizers like MIPROv2
For full observability when optimizing DSPy modules, enable the integration in both W\&B and Weave.
**Note**
As of `wandb==0.21.2` and `weave==0.52.5`, Weave initializes automatically when used with W\&B:
* If `weave` is imported and then `wandb.init()` is called (script case)
* If `wandb.init()` was called and then `weave` is imported later (notebook/Jupyter case)
No explicit `weave.init(...)` call is required.
## Install and authenticate
Install the required libraries and authenticate with W\&B:
1. Install the required libraries:
```shell theme={null}
pip install wandb weave dspy
```
2. Set the `WANDB_API_KEY` [environment variable](/models/track/environment-variables/) and log in. Replace `` with your W\&B API key:
```bash theme={null}
export WANDB_API_KEY=
wandb login
```
1. Install the required libraries:
```bash theme={null}
pip install wandb weave dspy
```
2. In your code, log in to W\&B:
```python theme={null}
import wandb
wandb.login()
```
Install and import the required libraries, then log in to W\&B:
```notebook theme={null}
!pip install wandb weave dspy
import wandb
wandb.login()
```
New to W\&B? See the [Quickstart](/models/quickstart/).
With the libraries installed and authentication in place, you're ready to instrument a DSPy optimization run.
## Track program optimization (experimental)
For DSPy optimizers that use `dspy.Evaluate` (such as MIPROv2), use the `WandbDSPyCallback` to log evaluation metrics over time and track program signature evolution in W\&B Tables. Attaching the callback lets you observe how the optimizer's score changes and how the program's prompts and signatures evolve across iterations.
```python theme={null}
import dspy
from dspy.datasets import MATH
import weave
import wandb
from wandb.integration.dspy import WandbDSPyCallback
# Initialize W&B (importing weave is sufficient; no explicit weave.init needed)
project_name = "dspy-optimization"
with wandb.init(project=project_name) as run:
# Add W&B callback to DSPy
dspy.settings.callbacks.append(
WandbDSPyCallback(run=run)
)
# Configure language models
teacher_lm = dspy.LM('openai/gpt-4o', max_tokens=2000, cache=True)
student_lm = dspy.LM('openai/gpt-4o-mini', max_tokens=2000)
dspy.configure(lm=student_lm)
# Load dataset and define program
dataset = MATH(subset='algebra')
program = dspy.ChainOfThought("question -> answer")
# Configure and run optimizer
optimizer = dspy.MIPROv2(
metric=dataset.metric,
auto="light",
num_threads=24,
teacher_settings=dict(lm=teacher_lm),
prompt_model=student_lm
)
optimized_program = optimizer.compile(
program,
trainset=dataset.train,
max_bootstrapped_demos=2,
max_labeled_demos=2
)
```
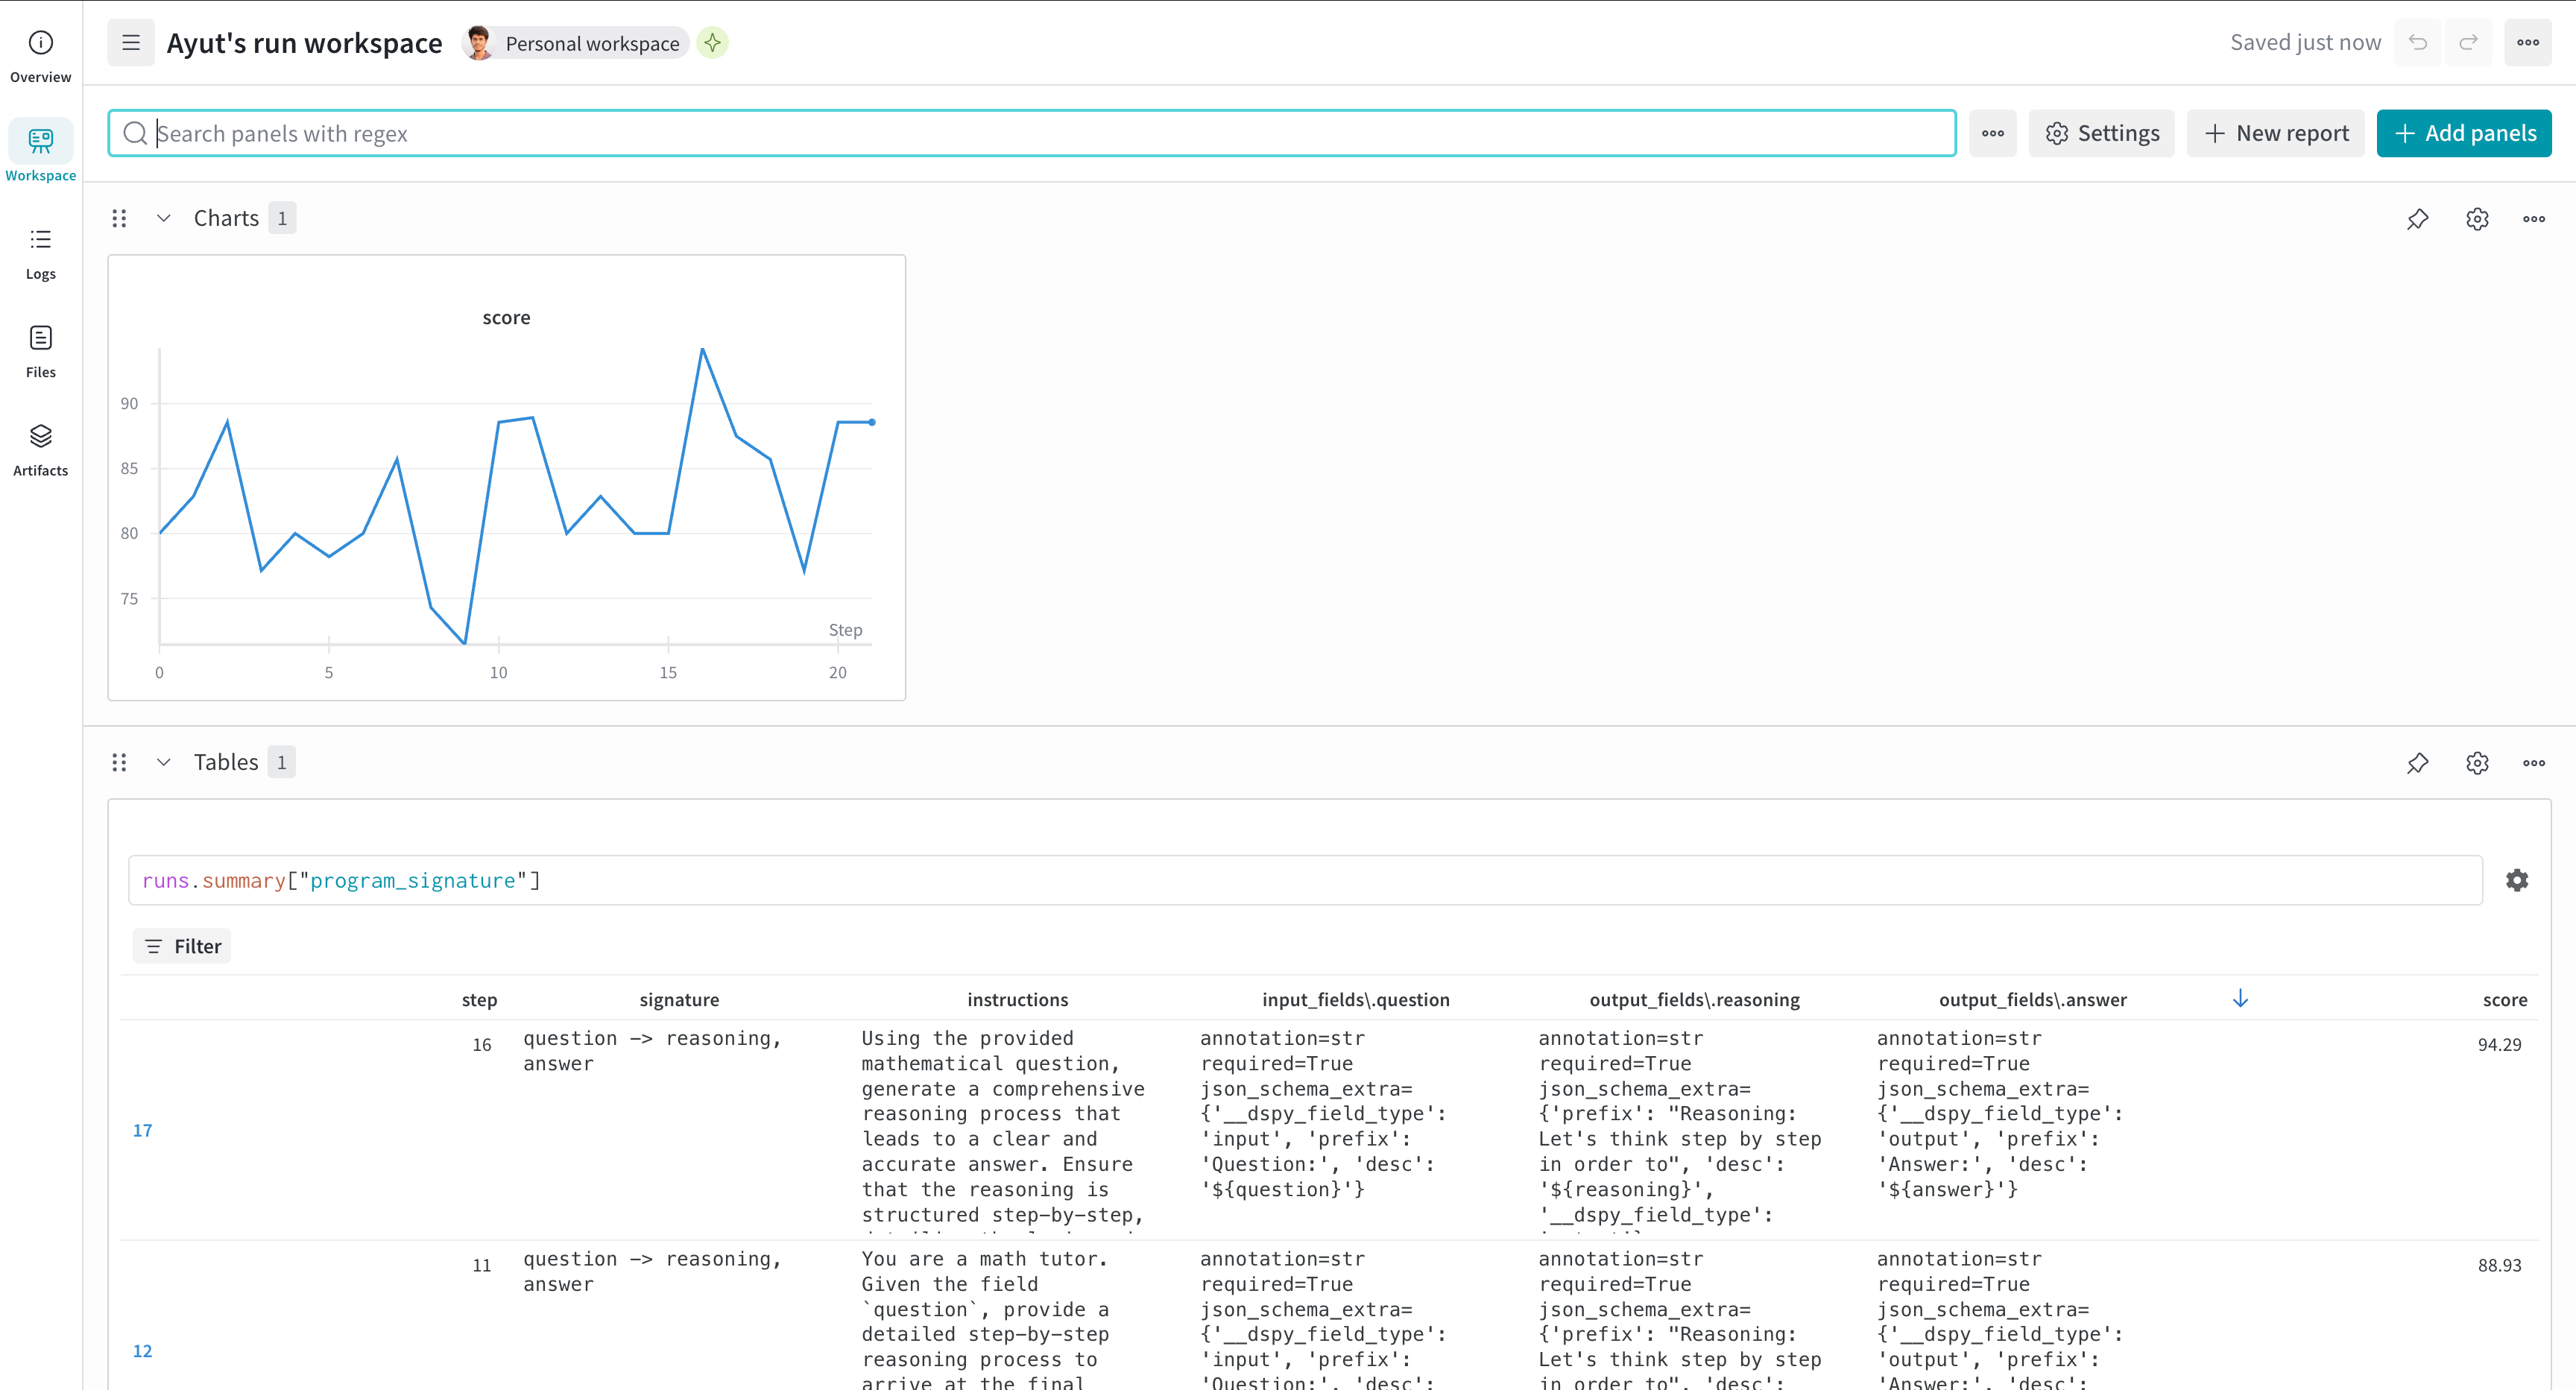
After running this code, you receive both a W\&B Run URL and a Weave URL. W\&B displays evaluation metrics over time, along with Tables that show the evolution of program signatures. The run's **Overview** tab includes links to Weave traces for detailed inspection.
If you don't pass a `run` object to `WandbDSPyCallback`, the callback uses the global `run` object.
 For details about Weave tracing, evaluation, and optimization with DSPy, see the [Weave DSPy integration guide](/weave/guides/integrations/dspy).
## Log predictions to W\&B Tables
In addition to aggregate metrics, you can enable detailed prediction logging to inspect individual examples during optimization. The callback creates a W\&B Table for each evaluation step, which helps you analyze specific successes and failures.
```python theme={null}
from wandb.integration.dspy import WandbDSPyCallback
# Enable prediction logging (enabled by default)
callback = WandbDSPyCallback(log_results=True)
dspy.settings.callbacks.append(callback)
# Run your optimization
optimized_program = optimizer.compile(program, trainset=train_data)
# Disable prediction logging if needed
# callback = WandbDSPyCallback(log_results=False)
```
### Access prediction data
After optimization, find your prediction data in W\&B:
1. Navigate to your run's **Overview** page.
2. Look for Table panels named with a pattern like `predictions_0` or `predictions_1`.
3. Filter by `is_correct` to analyze failures.
4. Compare tables across runs in the project workspace.
Each table includes columns for:
* `example`: Input data
* `prediction`: Model output
* `is_correct`: Evaluation result
Learn more in the [W\&B Tables guide](/models/tables/visualize-tables/).
## Save and version DSPy programs
Once you've identified a high-performing optimized program, save it as a W\&B Artifact so you can reproduce results and track versions over time. Choose between saving the complete program or only the state, depending on whether you need the full architecture or a lighter-weight checkpoint.
```python theme={null}
from wandb.integration.dspy import WandbDSPyCallback
# Create callback instance
callback = WandbDSPyCallback()
dspy.settings.callbacks.append(callback)
# Run optimization
optimized_program = optimizer.compile(program, trainset=train_data)
# Save options:
# 1. Complete program (recommended) - includes architecture and state
callback.log_best_model(optimized_program, save_program=True)
# 2. State only as JSON - lighter weight, human-readable
callback.log_best_model(optimized_program, save_program=False, filetype="json")
# 3. State only as pickle - preserves Python objects
callback.log_best_model(optimized_program, save_program=False, filetype="pkl")
# Add custom aliases for versioning
callback.log_best_model(
optimized_program,
save_program=True,
aliases=["best", "production", "v2.0"]
)
```
For details about Weave tracing, evaluation, and optimization with DSPy, see the [Weave DSPy integration guide](/weave/guides/integrations/dspy).
## Log predictions to W\&B Tables
In addition to aggregate metrics, you can enable detailed prediction logging to inspect individual examples during optimization. The callback creates a W\&B Table for each evaluation step, which helps you analyze specific successes and failures.
```python theme={null}
from wandb.integration.dspy import WandbDSPyCallback
# Enable prediction logging (enabled by default)
callback = WandbDSPyCallback(log_results=True)
dspy.settings.callbacks.append(callback)
# Run your optimization
optimized_program = optimizer.compile(program, trainset=train_data)
# Disable prediction logging if needed
# callback = WandbDSPyCallback(log_results=False)
```
### Access prediction data
After optimization, find your prediction data in W\&B:
1. Navigate to your run's **Overview** page.
2. Look for Table panels named with a pattern like `predictions_0` or `predictions_1`.
3. Filter by `is_correct` to analyze failures.
4. Compare tables across runs in the project workspace.
Each table includes columns for:
* `example`: Input data
* `prediction`: Model output
* `is_correct`: Evaluation result
Learn more in the [W\&B Tables guide](/models/tables/visualize-tables/).
## Save and version DSPy programs
Once you've identified a high-performing optimized program, save it as a W\&B Artifact so you can reproduce results and track versions over time. Choose between saving the complete program or only the state, depending on whether you need the full architecture or a lighter-weight checkpoint.
```python theme={null}
from wandb.integration.dspy import WandbDSPyCallback
# Create callback instance
callback = WandbDSPyCallback()
dspy.settings.callbacks.append(callback)
# Run optimization
optimized_program = optimizer.compile(program, trainset=train_data)
# Save options:
# 1. Complete program (recommended) - includes architecture and state
callback.log_best_model(optimized_program, save_program=True)
# 2. State only as JSON - lighter weight, human-readable
callback.log_best_model(optimized_program, save_program=False, filetype="json")
# 3. State only as pickle - preserves Python objects
callback.log_best_model(optimized_program, save_program=False, filetype="pkl")
# Add custom aliases for versioning
callback.log_best_model(
optimized_program,
save_program=True,
aliases=["best", "production", "v2.0"]
)
```